Operators Report
This page helps you review operator activity in Caramel for a selected time range. It is useful for checking staff performance across the main order flow, including Drop, Process, and Pickup.
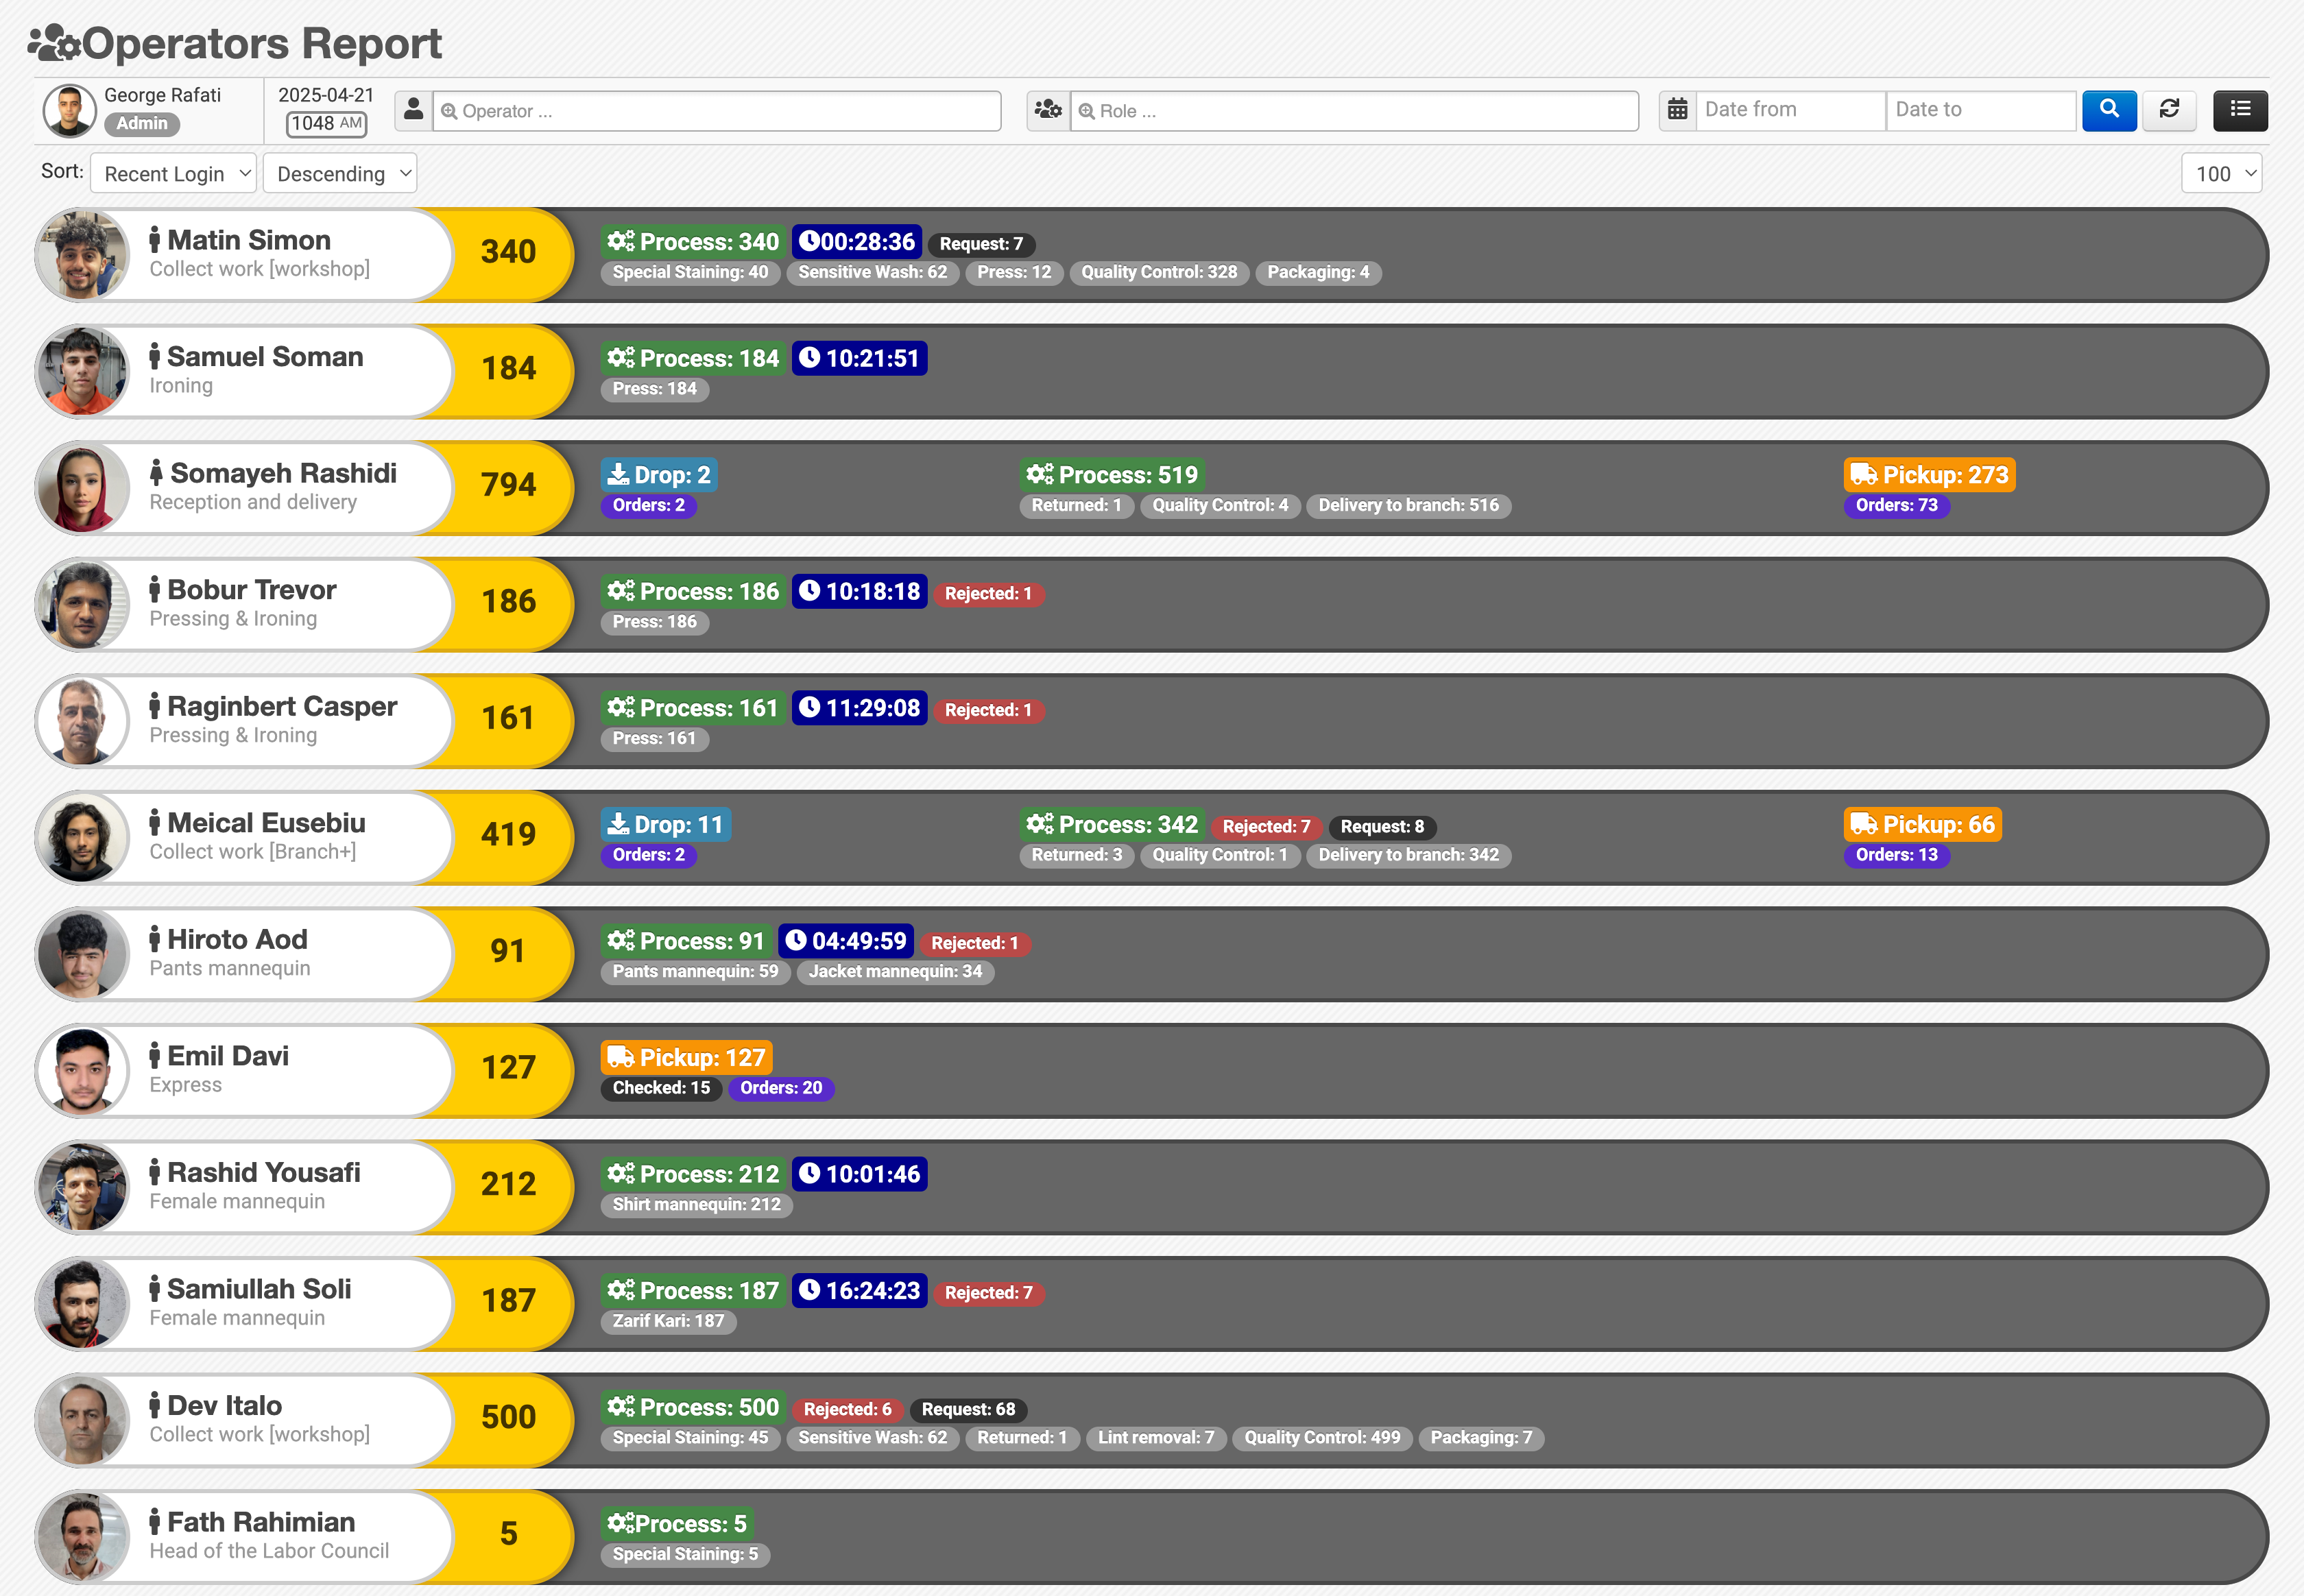
Top Menu Filters
At the top of the page, you can narrow the report using a few simple filters:
- Operator: Select one or more operators.
- Role: Select one or more roles.
- Date From: Set the start date and time for the report.
- Date To: Set the end date and time for the report.
- Search: Run the report using the selected filters.
- Reset: Clear all filters and return to the default view.
By default, the report is set to the current day.
Results Table Overview
The results are shown in a row-based table. Each row belongs to one user and starts with their name, role, and profile picture.
After that, the report shows two main summary areas:
- A yellow box for the total number of counted Item activities.
- A large gray area with a more detailed breakdown of activity by section.
Operator activity is grouped into three main categories:
- Drop
- Process
- Pickup
If a user has activity in more than one category, all relevant sections appear in the same row and the total is also shown in the yellow box.
If a user only works in one part of the workflow, only that section is displayed for that user. For example, drivers usually only have Pickup activity in their report.
Drop Report
The Drop section is shown in light blue.
It shows the number of Items registered by the user. This is typically used for reception or front-desk operators.
Additional badges may appear in this section:
- Barcode: The number of Items for which the user assigned a barcode or RFID.
- Orders: The number of orders confirmed by the user.
When you hover over the Orders badge, the total value of the orders confirmed by that user is also shown.
Process Report
The Process section is shown in green.
It shows the number of Items on which the user has performed at least one operation.
This section can include several additional badges:
- Useful Time: The user’s effective working time in hours and minutes, calculated by Caramel algorithms.
- Rejected: Items returned by quality control or returned again by the customer.
- Requested: Items for which the user submitted an operation request.
- Total Operations: The total number of operation records, not the number of Items.
A single Item may go through multiple operations. In that case, the main Process count increases once for the Item, while Total Operations increases based on the number of recorded operations.
Each individual operation performed by the user can also appear as a separate dark gray badge with its own count. For example:
- Washing: 34
- Quality Control: 26
- Pressing: 12
These are shown separately, and their combined operation records are reflected in the Total Operations badge.
Returned or Deducted Operations
In some cases, you may see a + value next to Total Operations or next to one of the individual operation badges, such as +4.
This means that some records were later removed from the user’s final operation statistics. This usually happens because of returns from quality control or customer returns.
This helps explain why the live daily numbers shown to operators on screens or monitors may be slightly higher than the final numbers you later see in the report.
Pickup Report
The Pickup section is shown in orange.
It shows the number of Items marked as picked up or checked out by the user.
This section may also include these badges:
- Checked: The number of Items checked out by scanning barcode or RFID, not manually.
- Orders: The number of orders completed or picked up by that user.
Clickable Badges
Most badges in the report are clickable and take you to the related Items Report page so you can review the matching Items in more detail.
The following badges are not clickable:
- Orders
- Checked
- Rejected
- Barcode
Disabled and Inactive Users
Users who have been disabled by an administrator are not included in the report.
If a user is still active but all of their values are zero, their entire row is shown with lower opacity to make inactive rows easier to distinguish.